Battery Ageing Model

Kia Soul EV Forum

Help Support Kia Soul EV Forum:

This site may earn a commission from merchant affiliate links, including eBay, Amazon, and others.
JejuSoul said:
mtndrew1 said:
Looks like I'm no longer an outlier.
No. That was a big jump downwards but that is not the first time I have seen this.You now join the rest of the pack. It's no longer worth making a ranking order because all our cars are pretty much the same (160,000km +/-10,000). Exceptions are zero deterioration new cars. And two outliers to the downside. ilectric who discusses his loss of range in the 26,000 mile thread. And Leafer who bought a demo car, which we assume was badly used/kept.

---------------------------

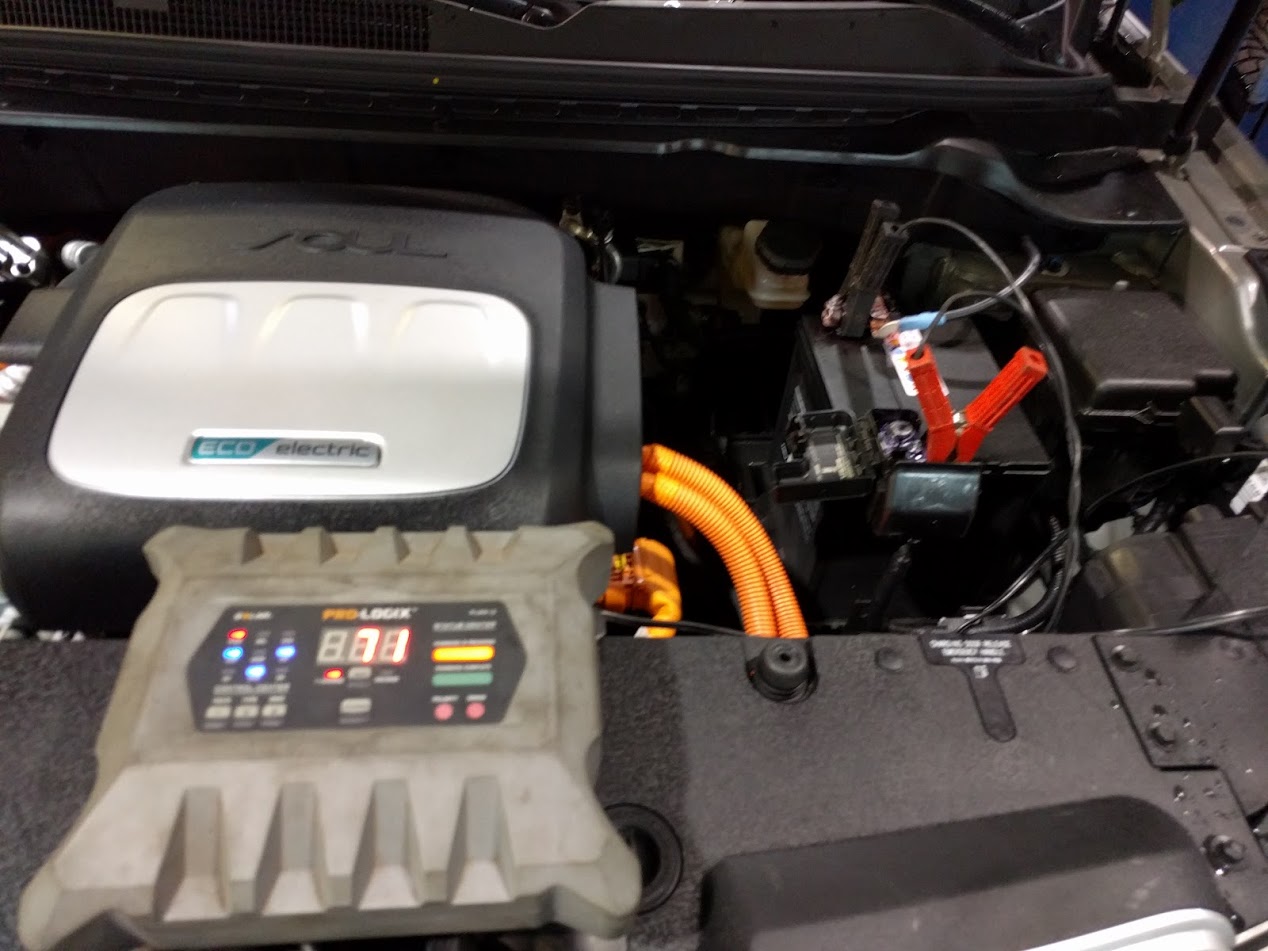
I charged from 7% to 100% last night as part of a calibration check.
Got 200km on the GOM for the first time in many months.

207lxt2.jpg


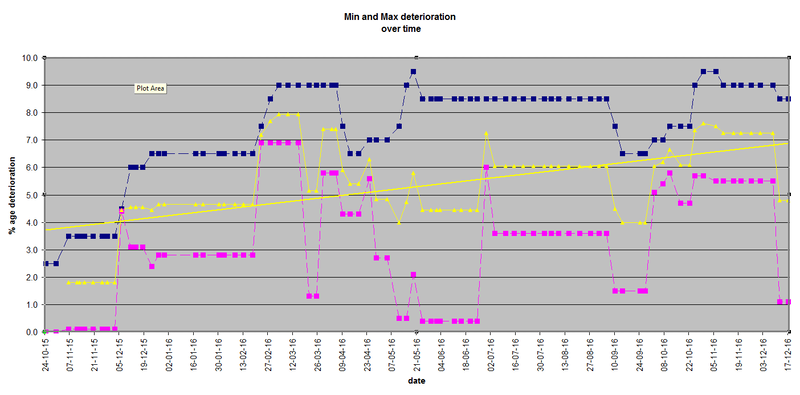
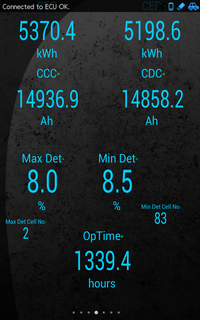
18 month old car 24,994km , max det 7.5%, min det 5.8%

Energy charged = 25.2 kWh => Full pack 25/0.925 = 27.24kWh
I am still confident that my car has 100% SOH

Not sure what you mean by 160,000km.. Do you mean projected mileage to 70% capacity?

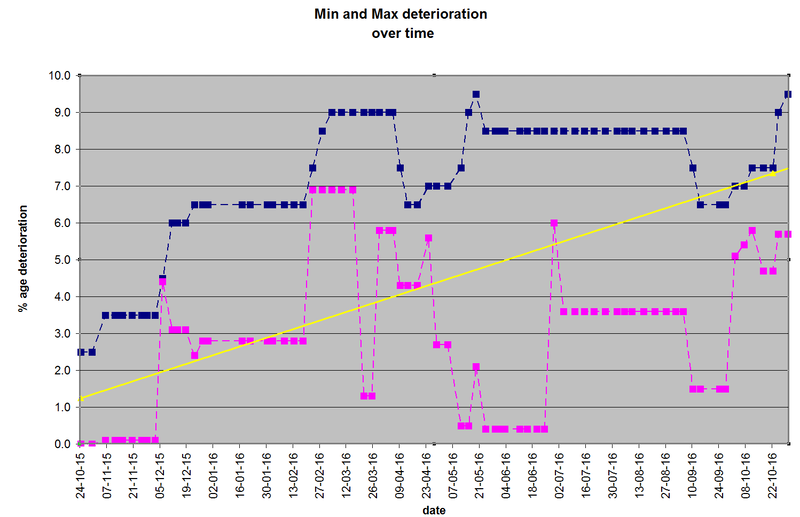
One issue I see with these calculations is that the degradation of lithium ion batteries may not be linear. I was of the belief that the first 10% or so is usually lost quickly, then the loss slows. I could have sworn I've read that somewhere, but can't recall where at the moment.

Another issue I see is with the use of min and max degraded cell values. Sure, that's the lowest and highest cell, but what about each cell in between? Perhaps when the two value are close together, the difference may not be material and the average will be representative of the group of cells.. But when the numbers are spread out more, what happens if the max degraded value is an outlier?

Is there no way to poll the Ecu for individual cell stats?

Anyway, I guess time will tell how these packs hold up.
 
2016Electric said:
Anyway, I guess time will tell how these packs hold up.
Yes. I hope this forum never has threads such as this one on the Nissan Leaf forum. 99 days to a new warranty battery...hopefully
Battery life span seems to me to be the major determinant of whether these cars are environmentally cost effective or not.
I really hope the Soul EV battery packs will last 20 years. As you say, I guess time will tell. So far, so good, but it's early days.

2016Electric said:
Another issue I see is with the use of min and max degraded cell values....what happens if the max degraded value is an outlier?
The simplest way to reduce the prevalence of outliers is to take multiple readings over time and plot them on a graph to find a trend.

Yesterday morning - max det 7.5%, min det 4.7%
Yesterday afternoon - max det 8.0, min det 8.5%
This morning - max det 8.5%, min det 8.5%
This afternoon - max det 9.0%, min det 5.7%

That the min was higher than the max is unusual, but this oddity didn't last long. It is only by tracking these numbers over time that they become useful.

Overall the data we are collecting for the Soul EV is quite consistent. Battery degradation is low. In comparison the Nissan Leaf has always had some cars with problems. These problems continue with the latest 30kWh model. see - 2016 30 kWh Battery data
 
I have now had my car for 18 months and 48000+ km. It's also 1 year since I started collecting data from the BMS.
Here's a graph of the deterioration values for one year/30000km. [I just linearized the average of first and last values to get a trend line.]

x8rus.jpg


Note that most of the data is from the 6 "summer" months. There were few deterioration changes during winter, probably because of different charging habits (100% charges and supporting charge at work, so SOC rarely dropped below 30%).
 
Here's the same kind of graph for my data. Car is 20 months old, travelled 26,000km.

While individual readings jump up and down it is the trend of the average values that is fairly consistent.

detoej8e.png


From an earlier post in this thread -
Elmil said:
...My feeling is that if you drive VERY gently and get most miles out of the used energy, the deterioration values will go down. So my interpretation is that the deterioration values are more connected to the DTE function than to the physical state of health of the battery.

I think the values we are seeing for Min and Max deterioration are a leading indicator that vary with how the battery is reacting at the time. It behaves differently according to temperature, driving style, charging profile ... Yes this is connected to the DTE function. The DTE / GOM always needs to know how much energy is available in the battery at this time according to current conditions.

The SOH however I guess will be a lagging indicator. It will change slowly and consistently much like our trendlines. Just guessing on this we have no data yet to prove this.

Update: seems I was wrong on guessing the SOH would be more consistent than the Max and Min. According to Elmil's data it is just the average of Max and Min.
 
Collecting the reports of SOH, measured by Kia while the car is being serviced.

First case of rapid battery deterioration.
A car in California. SOH = 91.2%, odo = 56,000 km, age 1 year - Re: Just Joined - Here's My EV Story

A car in Seoul Korea. SOH = 100%, odo = 25,000 km, age 1 year - 쏘울 EV 25,000km 주행기념, 배터리 열화도 체크결과 - Good !!

A car in Holland. SOH = 96.4%, odo = 40,000 km, age 2 years - Re: SOH change

A car in Norway. SOH = 100%, odo = 25,736 km, age 16 months - Re: Battery Ageing Model

A car in Germany. SOH = 96.2%, odo = 34,000 km, age ?? - SOH (Gesundheitsstatus) nach 34'000 Km

My car in Jeju Korea. SOH = 100%, odo = 20,500 km, age 15 months - Re: Driving Diary

A car in Sweden. SOH = 99.2%, odo = 45,267 km, age 17 months - SOH change
Same car in Sweden. SOH = 99.5%, odo = 48,978 km, age 18 months - SOH change
 
KIA Service Center did my SOH report today.

99.7%

MY2015 (originally delivered late October 2014).
Odo: 15,822km
Age: 2 years
Climate: Mediterranean

TorquePro Data:

Min Det: 10.0 %
Max Det: 11.0 %
Op Time: 1,804 hours
CEC: 3,748.8 kWh
CED: 3,709.2 kWh

This morning, with a full charge session timer scheduled, and 10 minutes left to charge ( I had to leave ) and 98% SOC (Display) I had a range of 163km ( 212 km is the claimed range ).
 
From 6 weeks ago -
JejuSoul said:
I began this morning with a fully charged car.
max det 7.5%, min det 4.7%. Started at 100% GOM 200km

I drove fast over the mountain 110km/h, decelerating hard before the speed cameras. Very unusual driving speed and style for my car.
An hour later my deterioration numbers were:

screenshot_2016-10-23owsy9.png
So today the numbers dropped back down. The last 6 weeks have been mild here, my driving has been sedate, never faster than 80km/h, charging between 30% to 80% SOC.

screenshot_2016-12-10gxu5s.png


As a one-off result it puts my car top of the list.
Using trend lines to get an averaged view the list is -
1/ GizmoEV - US
2/ Birkeland - Norway
3/ Elmil - Sweden
 
JejuSoul said:
From 6 weeks ago -
JejuSoul said:
I began this morning with a fully charged car.
max det 7.5%, min det 4.7%. Started at 100% GOM 200km

I drove fast over the mountain 110km/h, decelerating hard before the speed cameras. Very unusual driving speed and style for my car.
An hour later my deterioration numbers were:

screenshot_2016-10-23owsy9.png
So today the numbers dropped back down. The last 6 weeks have been mild here, my driving has been sedate, never faster than 80km/h, charging between 30% to 80% SOC.

screenshot_2016-12-10gxu5s.png


As a one-off result it puts my car top of the list.
Using trend lines to get an averaged view the list is -
1/ GizmoEV - US
2/ Birkeland - Norway
3/ Elmil - Sweden

In the first screenshot the Max Det (8.0 %) is less then the Min Det (8.5%).
In the last screenshot the Max Det increased (8.5 %), while the Min Det is very low (1.1%).
Is the Min Det. value formula the correct one?
 
ZuinigeRijder said:
In the first screenshot the Max Det (8.0 %) is less then the Min Det (8.5%).
In the last screenshot the Max Det increased (8.5 %), while the Min Det is very low (1.1%).
Is the Min Det. value formula the correct one?
I think it is, yes. These 2 readings are both oddities. That is the point of showing them.
In the first the numbers make a sudden, and strange jump upwards after a hard drive in the mountains.
It took 6 weeks for the numbers to adjust back down.
I think in both cases the BMS has over-compensated and is inaccurate.
If I did a 100% charge and a battery calibration I would probably get a more accurate reading.
The values we are showing are the correct formulas, they are odd, because the BMS is making strange adjustments.

I think my actual values for deterioration are somewhere between these 2 readings, which is why I average all the results over time.
 
On Friday I picked up a used 2016 Soul EV+. :D Now we have a White one which we picked up new on July 17, 2015 and the Blue one which appears to have gone into service in September 2015.

Here is the battery data from Torque Pro:
Mileage = 7,450
CCC (Ah) = 7,583.4
CDC (Ah) = 7,638.3
CEC (kWh) = 2,784.5
CED (kWh) = 2,707.0
OpTime (h) = 773.8
Min Det = 2.2%
Min Det Cell = 35
Max Det = 8.5%
Max Det cell = 3
SOC BMS = 94.5%
SOC Display = 99.5%

JejuSoul, I've added another tab to my battery data spreadsheet: White and Blue. Given that I purchased the Blue Soul EV+ and the White one is a lease with only 12k miles/year and we are already over 25k miles in a year and a half we will be putting more miles on the Blue one until we get the White's mileage in line so we don't have to pay as much of a penalty at the end of the lease if we chose not to keep it. It will be interesting to see the battery degradation differences with two similarly aged vehicles.
 
MinDET and MaxDET is usefull to know witch power is used from 1,1kW to 6,6kW.
if Min is low and Max is high, so the car is charged with a 32A line (6,6kW).
 
SoulEV2016 said:
MinDET and MaxDET is usefull to know witch power is used from 1,1kW to 6,6kW.
if Min is low and Max is high, so the car is charged with a 32A line (6,6kW).

The data is what I recorded before leaving the dealer. I presume it was charged at 6.6kW but I'm not sure because I didn't actually go inspect their L2 station. After a 100% charge last night at 18.4A*240V=4.4kW, assuming the charge rate is the same as my White Soul EV+, the deterioration values are still the same. I'm planning on building an OpenEVSE so I can charge at full rate when necessary.
 
Birkeland - thanks for the latest data. It puts you back on top of the list for least deterioration against both time and distance.

Using trend lines to get an averaged view the list is -
1/ Birkeland - Norway
2/ GizmoEV - US - PNW
3/ Elmil - Sweden

Am not sure if the variation being max and min deterioration is really about the level of charger. It may be more about how often you charge to 100%.
GizmoEV has two Soul EVs. One of which has a narrow variation the other wide.
That variation doesn't seem to make any difference to the average trended over time.

Here's an image showing the variation being max and min deterioration on my car. It is the trend in yellow that I use to make these results.

minandmaxoxupk.png


and for comparison this is Elmil's car

x8rus.jpg
 
mysoulev said:
I heard some people say it is ok to always charge to 100% with L2, it that true?
when you said SOH is 100%, does it mean % of battery degradation is less then the reserve?
is there any real world data for SoulEV battery degradation between DCQC, L2 and L1?
On the Nissan Leaf forum there are many threads with tips on how to destroy your battery quickly. The simplest way is to charge your car to 100% and park it in Death Valley for a few months. I have no doubt the SoulEV will behave the same way. It is heat that destroys the battery. Leaving the car at 100% in the heat is the quickest way to destroy your battery. However if your pattern of charging was to charge to 80% when you got home then top up to 100% just before leaving in the morning, I doubt there would be a problem. The battery will cool down overnight. It will not get too hot just doing the top up, and it will not stay at 100% for long. All this is really only relevant to those living in hot climates. I am not sure why anyone in Canada needs to worry about the car getting too hot.

SOH is State of Health - it measures the percentage remaining of the usable capacity. If SOH = 100% you haven't lost any usable capacity. My car has probably lost about 6% of the total capacity. The reserve at the top has got smaller. But it still has 100% SOH. For most of us I think rate of loss from original total capacity will decrease over time.

Real world data for L2 and L1. Look at the post above. My car only charges with L2. Elmil only uses L1. His is currently doing better. But that may be due to climate not charging. There is no evidence in the data we are collecting that shows a difference in deterioration between DCQC, L2 and L1.
The only car with problems was charged to 100%, driven very fast to nearly empty. Recharged at work and driven home also very fast to nearly empty.
That car lost about 20% of the total capacity in a single year. For this car I think rate of loss will increase over time if this pattern were kept up.
 
JejuSoul, thanks for the explanation.

last summer i met a Leaf owner at a public charging station who managed to rack up 70,000km in a year and a half, 100% DCQC (not hard to understand because he was a retiree). too bad i forgot to ask him if he noticed any battery degradation.
i jokingly said to him: he was saving like 5 grands a year so his gas savings would pay for the entire purchase price of the Leaf in a few years.
 
To contrast the effect of deterioration by time, against that of deterioration by distance travelled we have to measure a car that sits still for many months. I have been looking at some data from SiLiZiUMM to see if his car shows anything. It doesn't. It's now a year later, so we can see from the more recent battery data that the original data was fine. (If you only take a single reading from the BMS after not calibrating the battery for many months that reading may be inaccurate. But with many further readings you can get a trend and see more clearly if there is any discrepancy.)

His car has been fairly well tracked on this site.
Bought new July 2015 - Pics : 2016 model with sunroof option
Damaged August 2015 - Re: Soul Spy?

11885303_1153905617957190_7578742890493319636_n.jpg


In October 2015 we began getting OBD data from this broken car. - Re: Soul Spy?
SiLiZiUMM said:
...I just went to the repair shop to visit my real car (the titanium one), to see the main battery health (it's been parked there for 2 months now). The main battery got 2% drop from 80% to 78%. The 12v battery was dead on arrival (we used a portable battery to power the car). I added 2101/2105 readings in the sheet! There were no trouble codes...
The values of interest are the operating time, 196.2 hours, max det 1%, min det 0%, CEC 639 kWh, CED 617 kWh.

Repaired December 2015 - Re: Soul Spy?
OBD data now shows operating time 242.6 hours, max det 1.5%, min det 1%, CEC 1240 kWh, CED 1273 kWh.
SiLiZiUMM said:
... I insisted that they perform the ECU upgrade for SA203 as our vehicle had the problem while waiting for weeks parked in the repair shop parking (the 12V battery died). It seems it was a good idea to insist, as the 12V battery was only at 71% charged when we got in the shop....

SfZk6mo.jpg


Fixing the 12V battery has nothing to do with deterioration of the big HV battery. It's just a topic we are talking about on other threads so I thought thos photo was interesting. The main HV battery has declined a little over time as would be expected, but for some reason the Cumulative Energy Counters swapped from having a higher Charge than Discharge to the other way round. (SOC is similar for both readings.). Note this is Quebec. It wouldn't get very hot, and the SOC was 80%.

We now have data from a year later, and it does not seem that the period sitting idle had any bad effect on the HV battery. For some reason the Cumulative Energy Counters are still swapped from having a higher Charge than Discharge to the other way round. The only other car that has this is SoulEV2016.
 
Just a quick update of my current deterioration numbers as of 161231:

Max: 12.2%
Min: 10.4%
Odo: 53900km
 
Am still collecting reports of SOH, measured by Kia while the car is being serviced.
There's a new one from Norway.

First and only case of noticeable battery deterioration.
A car in California. SOH = 91.2%, odo = 56,000 km, age 1 year - Re: Just Joined - Here's My EV Story

A car in Seoul Korea. SOH = 100%, odo = 25,000 km, age 1 year - 쏘울 EV 25,000km 주행기념, 배터리 열화도 체크결과 - Good !!

A car in Holland. SOH = 96.4%, odo = 40,000 km, age 2 years - Re: SOH change

A car in Norway. SOH = 100%, odo = 25,736 km, age 16 months - Re: Battery Ageing Model

A car in Germany. SOH = 96.2%, odo = 34,000 km, age ?? - SOH (Gesundheitsstatus) nach 34'000 Km

My car in Jeju Korea. SOH = 100%, odo = 20,500 km, age 15 months - Re: Driving Diary

A car in Sweden. SOH = 99.2%, odo = 45,267 km, age 17 months - SOH change
Same car in Sweden. SOH = 99.5%, odo = 48,978 km, age 18 months - SOH change

A second car in Norway. SOH = 97.3%, odo = 45,000 km, age 25 months - Reduced battery capacity
 
Back
Top