Battery Ageing Model

Kia Soul EV Forum

Help Support Kia Soul EV Forum:

This site may earn a commission from merchant affiliate links, including eBay, Amazon, and others.
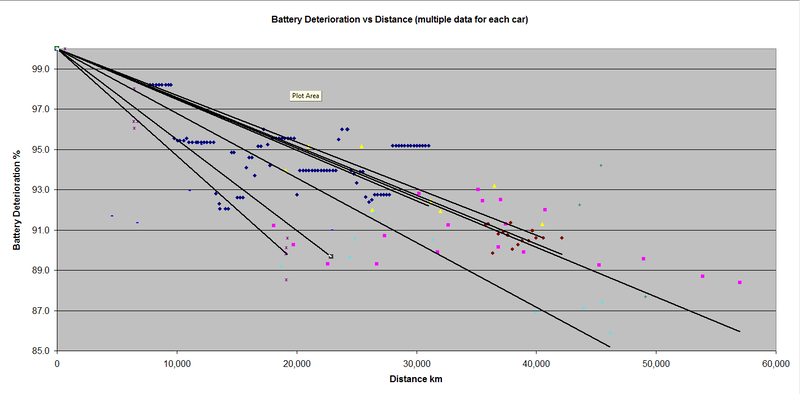
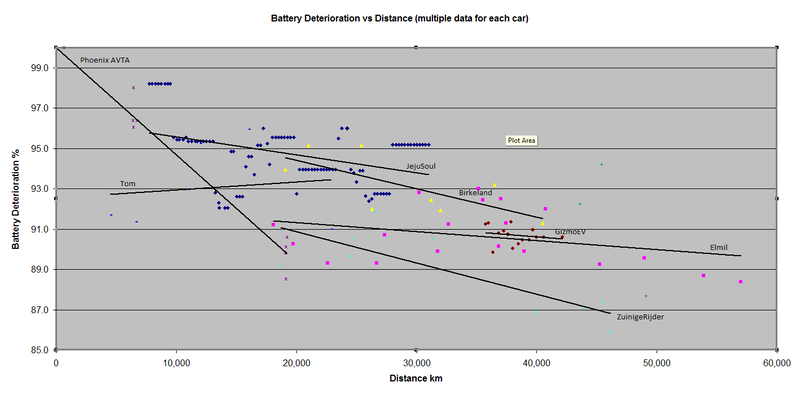
Here's the latest deterioration graph showing the battery data I am collecting.

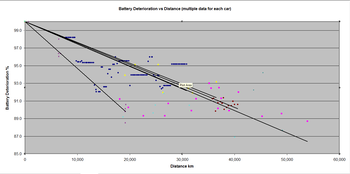
This graph is showing multiple data and trend lines for 4 cars from here, and 4 of the cars being tested by the AVTA at Phoenix.
Our 4 cars are in order from the top - Birkeland, GizmoEV, Elmil and JejuSoul. These measurements use OBD data.
We know it's valid for these cars because we have the official SOH data. See the post immediately before this.
(Note - there's a 10% buffer at the top. After two year's our cars are still SOH 100% because it is only that buffer that has been lost)
I am happy because after a mild winter my car hasn't shown any new deterioration, and my trend line has now almost caught up with Elmil.
Another month and I could be in the top 3!

The 4 cars being tested by the AVTA at Phoenix are averaged together to form one trend line. These measurements use lab data.


The 4 cars being tested by the AVTA at Phoenix are losing battery capacity twice as fast as our cars. But this is not a simple climate effect. My car is in a much warmer climate than Elmil's and yet is performing identically. We also have reports from drivers in Phoenix who are not suffering from battery deterioration. My assumption is that the cars being tested by the AVTA at Phoenix are being charged to 100% and then left in the sun. It is the combination of charging to 100% SOC and 40C heat that is damaging those cars.


The 4 cars doing best in my data set are all about two years old. They have all been owned by a single owner who has looked after the battery by not leaving the car at 100% SOC for long periods. There are a few ex-demo cars that are not doing as well, even though the current owner looks after the car. It seems possible that cars left at a dealer's lot for a year were left at 100% SOC and suffered quite heavy deterioration, even though they drove little.
 
I remember a report from a couple of years ago or so that had some unexpected results. Nissan Leaf's maybe? Though it wasn't what was being looked for the data showed that the batteries charged slowly in high temperatures degraded more than those that were quick charged at the same temperatures. The data indicated that maybe damage at high temperatures happened faster during charging than sitting. This makes some intuitive sense since during charging is when chemical reactions are taking place so negative side reactions might be catalyzed by it.

Jeju, are you able to see the data I've been posting in the Excel file I shared with you? There are two tabs, one for each of my Soul EVs. The White one is the one I picked up new the Blue one is the one that is slightly newer but I picked up used.
 
GizmoEV said:
Jeju, are you able to see the data I've been posting in the Excel file I shared with you? There are two tabs, one for each of my Soul EVs. The White one is the one I picked up new the Blue one is the one that is slightly newer but I picked up used.
Yes, I am adding the data from your Excel file. The car in the graph above is the white one.

The data being collected is not being done in the same way, but given a large number of datapoints for each car, that does not seem to matter. The trendlines are really close together. I think this shows consistency in the behaviour of the battery rather than random chance.

JejuSoul - takes a new reading every 250km.
Elmil - posts a new reading every time the deterioration values change.
SoulEV2016 - takes a new reading on the same day each month.
Birkeland - posts a new reading every so often. I don't recognise a pattern.
GizmoEV - you seem to be collecting data on the Soul EV that you happen to be driving that month. You have 2 Soul EVs. I think you are currently driving the owned car more because the leased car has too many miles.

The way data is collected would matter if there was a drastic change of use in the car. For example all these cars are commute cars. They are used the same way every month. But is someone set off on a round the world trip, or on the Dakar Rally, I think there would be be a completely different pattern.

----------------------------------------------

GizmoEV said:
I remember a report from a couple of years ago or so that had some unexpected results. Nissan Leaf's maybe? Though it wasn't what was being looked for the data showed that the batteries charged slowly in high temperatures degraded more than those that were quick charged at the same temperatures..
No, that test was done at the AVTA in Phoenix. The unexpected result was that in Phoenix using Quick Charging all the time was only slightly worse than Slow Charging. Everyone had assumed that Quick Charging would be much worse. The important point though is that all the cars in the Phoenix AVTA experiment exhibit much faster degradation than anywhere else. The reality was that those cars were deteriorating fast whatever method of charging was chosen.

I think the AVTA data is a fantastic resource. It shows how EVs behave in a worst case scenario. All the different EVs are tested in the same way. So you can compare EV against EV. The Quick Charge study however is a failure, because any major difference in charging pattern was drowned out by the rapid deterioration due to being in the Phoenix AVTA car park.
 
JejuSoul said:
GizmoEV - you seem to be collecting data on the Soul EV that you happen to be driving that month. You have 2 Soul EVs. I think you are currently driving the owned car more because the leased car has too many miles.

That is generally correct. I drive the Blue one on my 6 mile round trip commute and for out of town trips. My wife drives the White one on her about 20 mile commute and rarely goes out of town now. At the current rate the miles will be back down to within the lease amount a little before our lease runs out. This means that the White one will not get very many quick charges compared to the Blue one. Maybe there will be something noticeable in the battery degradation patterns with this change. Given that the blue one only had 7450 miles after a little over a year I doubt that it had very many quick charges.

It appears that the degradation values are updated on a 100% charge which both cars generally get once per week. I have to remember to get the values on the white one after the 100% charge Monday mornings.
 
Am continuing to look at the deterioration data graph shown below.


Am assuming that the upper set of trendlines represents a best case scenario. Most of our cars seem fairly close to this.
The lower trendline for Phoenix AVTA cars is the worst case scenario. None of our cars are anywhere near this bad.

As currently recorded the best case scenario seems to show that after two years and 40,000km (25,000miles) most of our cars will have no noticeable deterioration. SOH will still be 100%.

Reality is that the buffer at the top of the pack will have gone. After two years the total capacity will only be 90% of the original. I don't know whether a linear relationship will continue over the next few years. If it does then it seems Kia has estimated the battery warranty fairly accurately. The battery is going to last at least 8 years and 160,000km. I'm hoping for 16 years and 320,000km. Currently that seems unlikely.

-------------------------------------------

There's an interesting talk about the battery survey results collected by Plugin America. here -

https://www.youtube.com/watch?v=WLUUfmRkRcA

His talk is very cautious and careful not to dramatise the results. You only get a sense of possible negative data in the Q and A at the end.
I think the most interesting part of the talk is his analysis of the cost of battery deterioration per kWh throughput. He suggests a cost of 40 cents for each kWh cycled through the battery. He uses this to inform the economic reality of using V2G.

For our Soul EVs, if hypothetically a replacement battery costs $6,000USD and lasts only 1000 cycles (160,000km) then the cost of battery deterioration per kWh throughput is about 45 cents.
 
Interesting economic analysis, except that any time I periodically go on this site to scope out prices for such parts, I'm met with higher and higher potential costs. As it stands now, they want ~$16,500 USD for the pack assembly! :eek:
It's strange, because I'm pretty sure I recall seeing that pack a year ago for just over $10k USD...

Perhaps the $6k USD refers to Kia's replacement cost, and not the price the actual end consumer would pay?

https://www.kiapartsnow.com/genuine/kia-pack-assy-battery~37510e4000.html


Looks like the OBC is now over $2k USD, as well:

https://www.kiapartsnow.com/genuine/kia-onboard-charger~364000e040.html


I wonder why parts for this vehicle keep going up in price so dramatically? Early days, but this is not a good sign for long term ownership outside the warranty period, though.
 
The first time I measured the demo Kia Soul EV (bought when 1 year old) was 16 months old.
Average Deterioration was already 10.8 %.

Code:
Date		km		Avg Det
2016-01-17	18709	10.8
2016-01-27	19421	10.4
2016-01-28	19493	12.3
2016-02-01	19777	9.2
2016-02-10	20419	9.2
2016-02-20	21131	9.4
2016-03-04	22057	11.0
2016-03-07	22271	11.0
2016-03-07	22271	10.4
2016-03-11	22555	11.1
2016-03-14	22769	10.4
2016-03-21	23268	10.1
2016-03-25	23553	11.6
2016-04-01	24051	12.9
2016-04-08	24454	10.4
2016-04-12	24620	10.4
2016-04-13	24722	10.4
2016-04-14	24876	10.4
2016-04-15	24876	9.5
2016-04-26	25745	9.5
2016-05-04	26310	9.5
2016-05-06	26478	9.5
2016-05-06	26478	8.1
2016-05-25	27802	8.1
2016-05-26	27969	8.1
2016-05-26	27969	9.2
2016-05-30	28191	9.8
2016-06-20	30535	9.5
2016-07-01	31340	9.5
2016-07-12	31846	9.5
2016-07-15	32010	9.5
2016-07-15	32010	10.3
2016-07-25	32662	9.6
2016-09-08	35992	10.5
2016-09-16	36165	10.5
2016-09-19	36361	11.5
2016-09-21	36525	11.5
2016-09-21	36525	11.1
2016-09-26	36525	11.2
2016-10-03	37364	11.2
2016-10-03	37364	11.2
2016-10-21	38705	14.2
2016-10-21	38705	13.0
2016-10-27	39000	13.0
2016-10-27	39000	11.8
2016-11-08	39844	13.1
2016-11-09	39901	13.1
2017-01-09	43944	12.9
2017-01-31	45483	12.6
2017-02-08	46158	14.1

Recently the deterioration changed to 14.1%, without a recharge below 19% remaining capacity. Actually, I try to keep away from the lower remaining capacity. I normally recharge after 80km use. In the winter I recharge to 100%, otherwise to 80%.

Overall there is no steep line of loss of capacity, but apparently the biggest loss was before I owned the car (10.8% when first measured).

BatteryDeteriorationVskm20170208.jpg


BatteryDeteriorationVsTime20170208.jpg
 
ZuinigeRijder thanks for the data.
Your experience matches the other ex-demo cars we have data for.

I think a possible reason these cars suffer is that the dealer keeps them fully charged at 100% SOC the whole time.
The dealer always wants customers to see maximum range on the GOM.
There is nothing wrong with charging to 100% SOC if you use the car after charging it.
It's leaving it for months at a time at 100% that would be damaging.

ZuinigeRijder another question. How much did you pay for the car? How much discount did you get because the car was a year old?
If the price was low then perhaps it doesn't matter that the battery aged more than it should at the dealer's lot.

I just looked to see how much discount you should get buying a 1 year old car. I was slightly shocked.
From Kelley Blue Book - What Is 5-Year Cost to Own?. Depreciation in the first year is $19,821. Your car should be half the price of a new car.


If you click on the breakdown link for the Soul EV you will see this -

depreciationjmsbx.png
 
Hi all

I just like to write my datas for all you as information:

Now I have 22'666km and the following values:
Max. Det.: 10.0%
Min. Det._ 8.0%

We have winter at the moment.

It changend after last 6.6kW charging even I startet from 27% to 100% and not below 20% as recommended.

I charge usually never to 100% exept for "balancing" and if I drive after charging within some hours and in the last 2 years my car has a SOC more then 80% mabye for arround 100 hours in total maximum (since I have it). My car was arround 2.5 month at the dealer after import.
 
Tom: thanks for the data.
Your car was a negative outlier 15 months ago when you started recording this data.
Your deterioration is about the same now as it was then.
Hence it is now in the normal range, but not one of the best.

I suspect that the majority of the deterioration on your car happened before you bought it.
Can you tell me the last 4 digits of your VIN. That will give a more exact age.
Did the 2 1/2 months it was sitting on the dealer lot happen to be hot summer months. (July and August 2015)
Does it get hot in the summer where you are in Switzerland? How hot?
Was the car sitting outside in the sun all this time? Charged to 100%?

Am not sure it really matters leaving the car at 100% during the winter, or all night.
I think it is the combination of summer heat and 100% SOC that causes problems.
 
I will hopefully be getting my OBDLink MX tomorrow so I will be able to scan my battery (maybe not due to snow). My car was produced around December 2015, shipping to US on/about July 2016, and sold to the dealer October 2016. Current mileage is ~1000 miles. I do not expect to see any issues with my battery, but you never know...
 
JejuSoul said:
Tom: thanks for the data.
Your car was a negative outlier 15 months ago when you started recording this data.
Your deterioration is about the same now as it was then.
Hence it is now in the normal range, but not one of the best.

I suspect that the majority of the deterioration on your car happened before you bought it.
Can you tell me the last 4 digits of your VIN. That will give a more exact age.
Did the 2 1/2 months it was sitting on the dealer lot happen to be hot summer months. (July and August 2015)
Does it get hot in the summer where you are in Switzerland? How hot?
Was the car sitting outside in the sun all this time? Charged to 100%?

Am not sure it really matters leaving the car at 100% during the winter, or all night.
I think it is the combination of summer heat and 100% SOC that causes problems.

My car is the number 3096 (gray color) and sould be build arround March 2015.
(it looks like to produce daily/weekly or so by color if I check with other owners)
It was imported arround April 2015 first delivered to Germany and then bought by KIA Switzerland from a swiss direct import dealer (a very special situation against direct imported cars).
I bought the car of the beginning of July 2015 with 300Kilometers on it with a car-title from KIA Switzerland. So there was no owner befor.
What I remember was it not hot during this peroid of time until i bought the car.

Myself store the car in the garage and during winter I have arround 10 degress Celsius. During sommer arround 22 degres in my garage and so my battery.
At home I charge with 2.2kW (25% of all the energy i used so far) and very often with 45kW DC on the road (arround 50% of all the energy I used for the 22'000km) , 20% with 6.6kW and 5% with 3.3kW.
To 100% I charge maximum ones a month.
 
Tom said:
My car is the number 3096 (gray color) and should be build around March 2015.
Thanks Tom.
My theories about your car sitting charged during a hot summer are wrong. Good to know.
My guess is that your car was built at the end of January 2015.
Your car is about the same age as Birkeland's and is 3 months older than mine (#4294).
Your car was about 6 months old when you got it. Birkeland's about 3 months, and mine about a week.

For now we don't know why some cars start off with higher deterioration values than others.
We'll have to wait and see if any pattern emerges later.
 
New deterioration numbers. Odometer 40.500km

rfZyiVp.jpg


I have gotten the dreaded 12 Volt battery depleation problem, so I have been driving without the OBDII-adapter plugged in, in case this was draining my 12V battery.
 
JejuSoul said:
Tom said:
My car is the number 3096 (gray color) and should be build around March 2015.
Thanks Tom.
My theories about your car sitting charged during a hot summer are wrong. Good to know.
My guess is that your car was built at the end of January 2015.
Your car is about the same age as Birkeland's and is 3 months older than mine (#4294).
Your car was about 6 months old when you got it. Birkeland's about 3 months, and mine about a week.

For now we don't know why some cars start off with higher deterioration values than others.
We'll have to wait and see if any pattern emerges later.
Hm, mine is #3082 (white), and manufactured in february-15 according to the registration record. Very close to Tom's.. :)

Here's a graph of my deterioration and distance over time. In this scale one can see that the deterioration seems to have leveled after around 6 months and 20' km. Of cause it could have been all over the place during the first 6 months, while I had not started measuring, but this looks okay I think.

I'm now at 57000km and deterioration 12.4/10.8

Det_Odo_Time.jpg
 
Thanks for all the new data. Here's some updated charts.

1/ Normal chart that I use where all the cars start at 100%.
The order from the top - Birkeland, GizmoEV, Elmil, JejuSoul, ZuinigeRijder, Tom, Phoenix AVTA


2/ Same chart but only counting the actual data - no assumption that the car started at 100%


In this one Tom is winning. His trendline is going up. His car is gaining battery capacity.
Birkeland is the only car to have a trendline that is very similar to the one above.
ZuinigeRijder is parallel to Birkeland but 5% lower down.
Elmil and GizmoEV have lines that are almost identical.
 
Finally, I was able to get my scanner and it works perfectly. Looked for Min/Max Det, and both are currently 0.0 (have around 1000 miles on it, and live in a rust belt state). I am currently watching the car charge and seeing the charge power be positive, then negative, and then positive again (using 110V plugin).
 
New result:

Only one week later wit a total of 22770 Kilometer more I charged again at the same plug but this time from 10% to 100% in about 4 hours and 9 minutes (type2 outlet).
Now my new values are:
8.0%
6.4%

outside temperatur was about the same (freezing point) and charged outside after drove again 70 Kilometers with a battery temperature arround again 12 degres Celcius (so same condition here)
 
Tom said:
New result: Now my new values are:
8.0%
6.4%
Tom is winning. His trendline is going up. His car is gaining battery capacity. :)
My car does these rather large jumps occasionally too. After a large jump up, it yoyos up and down for a while before stabilising.
Or it could just be that charging from 10% to 100% has allowed the BMS to calibrate and this new one is a 'better' reading.

SmoothJ said:
Finally, I was able to get my scanner and it works perfectly.....
Great. Glad it is working now.
It is really useful to help understand the long term data if you can post updated data every few months or so. Also could you post some comments on where you live and how you use the car. Like this one by 2016Electric. (This one was the longest of all such writeups - that's why I like it best)
2016Electric said:
Climate: Toronto, Ontario (crappy, need I say more??).. lowest temp was Feb (if I recall correctly, -25C). Highest temp so far +25C last fall and maybe close to that a day or two a few weeks ago. Today was +7C to +10C or so. The vehicle is stored in an underground style parking garage, that usually does not fall below -5C.

Driving style: Mix of highway (100km/hr) and city (50-60 km/hr, in theory!) Trip meter tends to show around 36 km/hr avg. with Toronto traffic when driving just around town with no highway). The vehicle tends to get used during the week as a daily commuter, maybe 20-30 km per day max, at slower city speeds. On weekends, more highway around 80-100 km/hr, trips one way around 30-60 km average. At present, the dash is showing energy use of 15.3 kW/100km. Worst reading was highway use at -25C, lots of wind, and with snow tires mounted. I was pulling around 22 kW/100km that trip easily. Cabin was set to 22C. I might add.. aside from diminished range in the very cold temps, the car performed beautifully - perfectly smooth, quiet, and toasty warm. Average winter energy use was 18-20 kW/100km, mix of city/highway, and cabin set at 22C. I tried to use cabin pre-heat whenever possible (departing from home only, of course).

Charging behaviour: I use delayed charging almost exclusively, to charge the car beginning at 2am, set to 80%. This gives more than enough range during weekday commutes, even in the coldest months. Car probably stops charging usually within 2 hrs (so by 4 am), for the 7am morning commute. On weekends and when I know that I will be driving further, I charge to 100%, but try to plan whenever possible to reach a full charge shortly prior to departure (the timer works well for this).
The vehicle is charged at home, with 2 of three phases (commercial service) for a voltage that hovers between 208 and 2011 volts on average. The charger I built myself (OPENEVSE), which is set at 30 amps. During charging, the OPENEVSE reads 29.3 amp draw on its display when set at 30 (usually), which works out to 210x29.3=6.153kw. The reading I took this evening with the revised OBC codes showed 210.2 volts @ 28.7A and 6.0KW (so pretty close to my calcs).
I should add, in the winter I'd often plug the car in every night to take advantage of morning pre-heating, so SOC usually never fell below 55-60%, or went above 80%. Now that it's warmer, I push it a little more and don't feel compelled to charge every night. Still, I usually don't let the battery fall too low. Lowest ever was maybe 15%-19% or so.

Chademo:
I have used this maybe 3 or 4 times (unfortunately - I wish I had more opportunity to use this), mostly just to try it out. There are almost ZERO fast chargers around here.. and the greater Toronto area is home to around 6 million people. Truly, truly sad state of charing infrastructure at the moment here.. but I digress. Point being, not much fast charging on this battery pack, so far. .
 
Back
Top