Battery Calibration

Kia Soul EV Forum

Help Support Kia Soul EV Forum:

This site may earn a commission from merchant affiliate links, including eBay, Amazon, and others.

JejuSoul

Moderator
Staff member
Joined
Jul 8, 2015
Messages
1,931
Location
Jeju
-
A couple of users recently seemed to have gained range and improved battery performance after either an L1 slow charge to 100% , a lengthy road trip, or both.

mtndrew1 said:
... So yesterday I pulled the 240V at 75% and let the car charge to 100% overnight on the 120V charge cable thinking that may give the car some cell balancing opportunity. I have no data to back it up, but it sure seems to have worked as I achieved my highest-ever capacity remaining estimate yesterday aside from the tightly-controlled Tony Williams test...
here : - Battery Degradation and Performance Patterns

SiLiZiUMM said:
I'm back from a 500+ trip again :lol: 3 QC stations visited on each way. On our way back, we almost pushed the limits of the battery, skipping a few QC in Québec City. We arrived there at 3%, with the turtle blinking :)

On our way back, the deterioration values changed. It was "7EC 24 00 32 2B 00 06 0D" before, I have now "7EC 24 00 2D 2D 00 01 01".
here : Soul Spy

Perhaps this is consistent with a recommendation on the Battery University site to do a battery calibration once every 3 months.
See :- BU-603: How to Calibrate a “Smart” Battery
calib1o5jd9.jpg


-
 
Interesting post and article from Battery University. The manual of the Kia Soul recommends to fully charge the High Voltage Battery once a month or more often. They do not say why, but it is most likely because of battery calibration.

I use a 6.6kW charger (the manual refers to this as "normal" charger, and the L1-charger that comes with the car as a "trickle-charger" which is only to be used if "normal-charger" is not available). The reason for this is probably because the battery is in a state of chemical processes when charging, and the slower the charger, the longer the battery is undergoing chemical processes which is also a factor in battery degradation.

My question is if it is possible to achieve the same effect of calibration with the 6.6kWh charger, or if I should use the 10Ah(2.3kWh) charger that came with the car.
 
this is anecdotal, but i was charging my RAV4EV for about 8 months on its L1 trickle EVSE before upgrading to a 40A L2 one. when I switched to L2, I noticed a drop in my range. At first, I thought there was something to it, but I came to realize when I was on L1, I would try and maximize my range via my driving style. On L2, I was less concerned with being conservative and definitely took more advantage of the power. The actual difference between charging on L1 and L2 are probably negligible with L2 being more cost effective since it you will have a greater power efficiency.
 
This topic of calibration poses an interesting question - are the increases in range and performance real, or just corrections to earlier less accurate data. Battery University in the link above states that anomalies contribute to errors that are inherent to all smart batteries and in time manifest themselves in false state-of-charge estimations and other discrepancies.

We are also talking about 3 possibly different effects. Or perhaps these 3 are aspects of the same thing.
1/ Calibration.
2/ Cell Balancing.
3/ Increased energy input using L1 ch argers. (this one improves actual range not just the displayed data)

It is possible that in the first case above (mtndrew1) we are merely seeing effect 3. We have no data to show that the 96 battery cells were imbalanced beforehand nor balanced afterwards.
There is a quote about this here : Road Trip: Atlanta to NJ and back. LONG post w/ Stats
roxworld said:
Layered charging: Just remember that 100% is usually not 100% if it wasn't reached with the slowest charging method.
Before a big road segment, I often will QC, followed by L2 and top off with a trickle charge for the maximum charge.
The second case (SiLiZiUMM ) seems to show effect 1. We do have battery cell data for this car. It shows slight improvement in cell balance on an L1 charge to 94%. But that slight improvement is similar on all L2 ch argers I have seen too. (from 6 cells varying by 0.1 V with the rest to only 1 varying). There is no change to the battery deterioration data at this point. The better values for the battery's deterioration are seen at the next stop of a lengthy trip.

To answer the question is it possible to achieve the same effect of calibration with the 6.6kWh ch arger, I assume yes. I did a road trip last week to test this. I L2 charged to 100%, drove 215km and then charged back up again. I measured my battery's health before and after. No loss, no gain. But my battery already had very low deterioration. I intend to do the same thing next month ( to test the effect of temperature on driving distance) so will let you know if any calibration occurs.
 
We are in a condo and don't have a level 2 charger, so every night we charge overnight with the Level 1 charger and during the day while at work we use a level to 30a we installed at work. Last week took a long drive and took it down to a 3% charge and plugged it in for 30 hours of the level 1 charger. Still 130km at 100%.
 
JejuSoul said:
To answer the question is it possible to achieve the same effect of calibration with the 6.6kWh ch arger, I assume yes. I did a road trip last week to test this. I L2 charged to 100%, drove 215km and then charged back up again. I measured my battery's health before and after. No loss, no gain. But my battery already had very low deterioration.
The answer to the above is, "yes". Battery Calibration does occur using a normal ch arger (L2) and not just the trickle ch arger (L1). Also the calibration effect can be either up or down.

Over the last month I have seen the following changes occur after a 100% L2 charge.
After a big jump up - which I assume is a calibration effect - the maximum deterioration has risen slowly.
After a similar big jump up the minimum deterioration has fallen slowly.
My car is 7 months old and has about 11,000km.

From about 8,000 to 10,000 nothing happened (max det 3.5%, min det 0.1%)
Then the following.
9,752km (max det 4.5%, min det 4.4%)
9,950km (max det 5.5%, min det 4.4%)
10,003km (max det 6.0%, min det 3.1%)
10,794km (max det 6.5%, min det 2.4%)
 
JejuSoul:
Last night another jump in the deterioration values occured during normal (2 kW) charging overnight.
The deterioration values jumped up from 10.3/9.2 to 11.2/10.2 and this was at 22610 km and 5 weeks since last change. All 96 battery cells showed 4.08V (0xCC) just as they did last time the deterioration values changed.
 
For me the battery deterioration is going up and down since I have the OBDII dongle.

Max Deterioration % is going from 11.6 to 11.1 to 13.4 and back to 10.2 today.
Min Deterioration % is going from 10 to 9.6 to 11.1 and back to 8.2 today.

Always use a normal charger at work, I believe 3.6 kW max, and now and then my home charger @ 2 kW.
 
ZuinigeRijder said:
For me the battery deterioration is going up and down since I have the OBDII dongle.
As I said before I think this seems quite normal. Three of the four cars for which we have multiple data seem to do this. But we do have a very small dataset so perhaps all 3 of these cars are outliers. I doubt it but it is possible. Evidence for my view is that Battery University suggests than an accurate value for SOH is hard to get.

Had you written your post on the mynissanl eaf forum however you would have been dismissed as a Troll or an idiot.
Just look at the thread : "SOH value jumping around."
People on that thread seem to believe that SOH will always be measured accurately to 1/100 of a percent and will decline in a perfectly linear fashion. Given the data we are getting I would put an error band of +/- 5%, with all kinds of yo-yoing and stepped descent. The margin of error we are getting makes it hard to make any judgement on a particular driving or charging style. We can't even say that climate makes any difference to deterioration. Hopefully with more data we can average out some of the errors.
 
So, I finally got another change in my deterioration values. And this time they took a big leap backwards!
Code:
Date	     Km	     Max   Cell	 Min	 Cell	SOC
2015-11-01           9.3%   32     8.3%    1	92.5%
2015-11-05  18780    9.8%    2     8.4%    8	92.5%
2015-11-19  19751   10.3%   24     9.2%    1	91.5%
2015-12-23  22610   11.2%    3    10.2%    8	92.0%
2016-02-29  27339    9.8%    2     8,8%    8	92.0%
During winter I have been charging to 100% most of the time, and rarely drained the battery more than down to 30%. Yesterday I drained it down to 9% displayed (10% batt) and in the following nightly charge the update came. And as every time before, the update happened when all 96 cells displayed 0xCC (2.04V) and at around 92% displayed SOC.
It looks very clear that some sort of calibration is done when the BMC gets the opportunity to look at a wider range of SOC. So the fact that people observe deterioration values "jumping around" could possibly be connected to a greater variation in charging/discharging habits.

Another interesting finding from my logs is this:
Code:
SOC(bat) Ah	  kWh
10 - 50% 31,4	10,9
50 - 90% 31,8	12,9
The data is from last night's charging, and the table shows that charged Ah's are basically the same from 10 to 50% as they are from 50 to 90%. But the kWh's are less at the lower 40% than at the upper 40%. This is actually quite logical, as the kWh's are depending on the battery voltage, which is around 20% higher at 90% SOC than at 10% (during 2kW L2 charging). I see the same pattern in all data that I have analyzed.
The conclusion must be that the SOC numbers for at least the total battery is the percentage of Amp hours, not kW hours. The displayed SOC is a bit biased in respect to the total (display is ~51.5% at 50%bat), but even so, one SOC% is much more equal across 10-90% if it is based on Ah. Not a surprise really, but we didn't know for sure if Kia had linearized to the kWh's or not. I think they have not.
 
I also did an experiment, because my battery deterioration values were rather constant the last month. And I suspected this was the case, because I always charged to 100%.

Code:
Max Det	Min Det	Max Cell	Min Cell
11.6	10.0	3	15
11.1	9.6		
13.4	11.1	43	51
10.2	8.2		
10	8.4		
10.4	8.4

The last value above was almost a month constant.
Last week I just charged for 3 days to 80%. And guess, what happened? The battery deterioration got worse.

Code:
11.6	10.4	3	8

Today I charged again to 100% after the remaining battery was 17%. After the 100% charge (3.7 kW charger) the values did improve again
Code:
11.1	9.6	3	83

The battery calibration seems only to work when charging till 100%. Most people do not see deterioration in the winter, because probably most people charge to 100% for better range.

In general it is better to have the battery not fully charged, best is to have a 50% SOC. But apparently the calibration only works above 80%, so this has a negative effect. Conclusion seems to be that it is better to full charge, with 100% charged just before you leave.
 
ZuinigeRijder said:
In general it is better to have the battery not fully charged, best is to have a 50% SOC. But apparently the calibration only works above 80%, so this has a negative effect. Conclusion seems to be that it is better to full charge, with 100% charged just before you leave.
The same feeling as I have had about this. And from my data logs I can tell, with reasonable confidence, that the calibration is done at around 92% SOC. It did every time the deterioration values changed for me.
Actually, with the relatively high frequency the deterioration values seem to be changing, both upwards and downwards, they might be better called 'Calibration Factors' or something like that... But we still don't know exactly what they do.
We need a BMS snapshot from someone who has got a GDS/KDS printout with SOH less than 100%. If noone's there yet, at least I'm having 2:nd service in next month (30000km) and would be rather surprised if it's still at 100%.
 
ZuinigeRijder said:
In general it is better to have the battery not fully charged, best is to have a 50% SOC. But apparently the calibration only works above 80%, so this has a negative effect. Conclusion seems to be that it is better to full charge, with 100% charged just before you leave.
Splitting these ideas -
1/ "...In general it is better to have the battery not fully charged, best is to have a 50% SOC..." Yes. Somewhere between 80% and 20% is best.
2/ "...the calibration only works above 80%..." Yes.
3/ "... so this has a negative effect." Mostly No. Battery calibration is entirely neutral as regards the battery. All it does is adjust the BMS SOH data so that the GOM has a better estimate of the range. Calibration can be up or down. The battery does not care what the GOM says. The battery goes as far as its electrical capacity allows. If the driver ignores the GOM and drives the car as usual battery calibration is irrelevant. Similarly the deterioration numbers that the BMS provides are less important than the actual distances the car drives.
4/ "...Conclusion seems to be that it is better to full charge, with 100% charged just before you leave..."Mostly Yes. If you want or need to charge to 100% then it is best that the charging finishes just before you leave. But this has little to do with calibration.

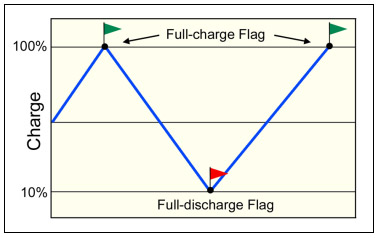
From the Battery University Page about Calibration.
For a calibration to occur this needs to happen.
calib1o5jd9.jpg

I normally charge my car up to 80% when it gets down to 30%. The lowest I have ever gone is 15%.
Over the last six months I have had two large jumps up in the deterioration numbers.
The first came after a 100% charge the second did not.
Hence there are other reasons for the deterioration numbers to leap about.
I intend to do a calibration check in the next week or so. Will post again then.

Update: 12th April - I did a calibration check last week
Deterioration values did reset. min det reduced from 6.8% to 5.5% at just above 4.08V (some cells were showing 4.10V) It was at 92% SOC, Battery pack =393V
The numbers changed at 100% SOC as well. Perhaps a cell balancing effect. It is the change at 4.08V 92% SOC that I would like to call the calibration effect.
 
-
Here's an interesting comment from the MyNissanL eaf forum that I think is relevant to our discussion on battery calibration.

RegGuheert said:
Here's my take:
- Capacity, as reported by the instrumentation in the L EAF, is DISCHARGE capacity at a particular discharge rate. This is the capacity which matters when trying to drive a particular distance.
- The discharge rate at which the L EAF estimates remaining capacity is likely rather high: probably a C rate (1-hour discharge).
- The PRIMARY degradation that has occurred in our batteries over time is an increase in the RESISTANCE of the battery. I will guess that the resistance of our batteries has approximately doubled from about 60 mOhms to around 120 mOhms, maybe much more.
- The resistance of some cells increases faster than other cells. This makes it harder for the battery management system (BMS) to keep the cells balanced.
- The L EAF's instrumentation ultimately bases ALL of its estimates of SOC on battery voltages.
- The L EAF's instrumentation seldom has the opportunity to measure the battery voltage under no-load (zero current) conditions. Instead, it mostly measures the battery while it is either discharging OR charging.

The practical result of all of the above is this:
- Our batteries are ABSOLUTELY degraded. They are NOT the same as they were when they were new.
- In normal use, our batteries will typically charge to a lower SOC than they did when they were new and the SOC will drop rapidly when we start driving the car.
- LBW and VLBW occur at significantly higher SOCs than when the vehicle was new. It has been reported that LBW occurred at 17.8% SOC when our cars were new, but I now see it at about 26% SOC. This is quite a bit more of an increase than one would expect from losing 22% of the battery's capacity.
- Under "normal" charging and driving conditions (60 MPH) we likely can only go about 78% as far from full to LBW as we could when the car was new. (Tony Williams has done extensive testing that bears this out.)
- BUT, if we can manage to get the battery well-balanced and charged to a very high SOC AND we drive slowly AND we use L eafSpy to know what the actual SOC is, we can still drive almost as far as we could when the car was new under similar circumstances. But this is only true IN WARM WEATHER.
- Unfortunately, in cold weather (below about 30F), the effects of the degradation are felt much more strongly, even if you try to use all the tricks I have mentioned. This is due to a further multiple increase in the resistance of the battery AND the need to run the heater and/or the defroster in those conditions.

Note that none of what I have discussed above will affect what the instruments in the dash display. You won't see capacity bars return or anything like that.

Now for some notes on charging to a high SOC and achieving a good balance:
- You need to charge to full multiple times over the course of a few days if you want to be able to fully charge the battery.
- If you want to charge to a high SOC in a MY2011/2012 L EAF, you need to charge more slowly at the end of the charge (last hour or more). Here are some ways to do this: A) turn on the air conditioner while charging, B) charge at L1 rates (120V) or C) do both. (If you have a 2014(?) or later EV SEUpgrade, you may have the option to control the charging rate using that, as well.)

The bottom line seems to be that increases in resistance of the L EAF's battery are the most significant form of degradation for many of our vehicles, which means that more of the capacity remains than the instruments let on. The trick is in accessing that capacity when you really need it.
From : LeafSpy reporting only 15.6 kWh after charging 100%?

-
 
Yesterday and today I made a range check, to compare with a similar trip a year ago, although last summer I didn't have the nice Soul Spy stuff. :)

Code:
[km]       July -15  July -16
Odometer    7379     38936
Distance    222.2    212.2
SOC Remain    4%       2.0% user/3.5% battery
kWh/100km    11.6     11.8
Avg speed   45km/h    45km/h
Still reach NEDC :cool: but more interesting is that I let the car run flat when parked at home, so now I have real world measurements of the total available energy capacity!

Rated Discharge Amperage: 75 Ah. Now 73.0 Ah (97%)
Rated Discharge Energy : 27 kWh. Now 25.9 kWh (96%)

The car is charging right now, will do 100% and I'll get back with the new deterioration values.

Edit: As expected, the deterioration values improved, they jumped back from 10.6%/9.6% to 8.5%/7.5%.
The DTE at 100% also improved from 164 km to 170 km.
Charging from 0 to 100% added 74.4 Ah / 26.8 kWh to the battery.

When the car turned itself off, the user SOC was 1.0% and went immediately to 0.0%, while the battery SOC just stepped down from 2.5% to 2.0%. The reverse happened when charging started, user SOC went to 1.0% and battery SOC to 2.5%.
Also, at the off state the 12V system was still fully operating (incl the headlights), and a message was displayed on the NAV screen: The vehicle cannot be started. Connect the charging cable.
 
For 3 hot summer months I have been charging my car from 20% up to only 50%.
The deterioration counters have been static. Max 8.5%, Min 3.6%

Today I just finished a battery calibration.
On 5th September I charged to 100%.
After this charge the deterioration counters dropped to. Max 8.0%, Min 1.5%

On 9th September I charged from 9% to 100%.
After this charge the deterioration counters also dropped to. Max 7.5%, Min 1.5%
( Annoyingly the battery on my android tablet failed when the car got to 94% SOC 4.10V - so I cannot tell when calibration occurred.
It happened after this.)

The data for the charging session:
The DTE at 100% improved from 178 km to 197 km.
Charging from 9% to 100% added 67.3 Ah / 24.6 kWh to the battery.
Equivalent to 74Ah and 27kWh for a 100% charge.
 
JejuSoul said:
( Annoyingly the battery on my android tablet failed when the car got to 94% SOC 4.10V - so I cannot tell when calibration occurred.
It happened after this.)
Calibration after 94% is different to what I see in my car. I always have the calibration at 392.5 +/-0.1V battery voltage, 4.08V (0xCC) cell voltage and 91.5-92.5% SOC.

I use the 2.0kW EVSE that came with the car, if you charge using more power perhaps that is the difference.
 
Excellent article Jeju. Here is an example of extensive cell testing showing different energy provided at different power levels:

http://www.candlepowerforums.com/vb...-Test-review-of-AW-17500-1100mAh-(Black)-2016

This is just an example of LiIon cell chemistry (Soul EV is different chemistry but should behave in a very similar way). In particular discharge energy chart:

0.2A = 4.2 Wh (approximate from reading chart)
3A = 3.7 Wh

So at 2.7C in this test we get 12% less energy
(again these are approximate from chart)

In summer easy driving will pull around 13 kW which is 0.43C so we get almost max energy output. In winter if you start pulling say 20 kW (snow/wind increased resistance, heating, etc.) now it is 0.7C
Keep in mind during acceleration we pull 1C - 2C

This is another reason (besides increased air resistance at higher speed) why range drops at higher speeds.

Back to balancing,

From the LiIon forums indeed there are discussions about individual cells going out of balance in a pack, especially 4+ cell flashlights. Couple of factors to consider:

- high quality cells (example Eneloop) will have a very consistent performance and will be less out of balance
- new cells will be more consistent, less out of balance
- best way to balance is a slow charge

Here is my interpretation of the best rules to follow based on these factors and stuff I read on forums:

1) for a new pack/car (less than 50K) cells should remain fairly balanced most of the time
2) for older packs (over 80K) increased internal resistance differences for different cells will cause more balancing issues more often
3) so new pack needs less frequent balancing, older more frequent balancing

To balance as pointed above:

Repeat 2-4 times:
1) Level 2 to 90%
2) Level 1 from 90% to 100%

Important point is that you don't need to worry about balancing too much until your car is older, especially when not going below 30% SOC. Even if a particular cell is lower than others at 30% SOC it means it may be 25% or 20% or even 15% which is still fine.

Thanks for the reminder when Level 1 is still useful as other posts were talking about Level 1 being useless and wasteful.
 
slobodanc said:
Thanks for the reminder when Level 1 is still useful as other posts were talking about Level 1 being useless and wasteful.
I now have a Level 1 trickle ch arger. I decided it was worth having after my camping trip in an I oniq EV.
It's a Delphi made for the i 3. I won it in a raffle.
I will test this at a future date to see if works better for calibration / balancing than L2.

It is less efficient ~85% for the L2 and ~70% for the L1.
 
good test.

i have already increase the power of my EVSE charger to see if deterioration is linked to the power of the BMS balancer capacity (but, in first objectif to confirm or not the raise of the efficiently of onboard charger).

i do this after the first 5000km at 1,1kW (154 charges).
now, i am at 2,2kW.

and deterioration have raising since this change ... :lol:
and consumption at the grid is very erratic, too ... :?

this aspect indicate that the BMS have, really, a strategy to use the balancer power capacity from charge to charge or to monitor a charge (no balancer used) and do somes corrections on the following charge (result : erratic consumption at the grid) but only on specifics cells (temperature saturation over the balancer power capacity).

This aspect is very hard to monitor.

But, over many charges, i can see this (that's why i only change setting after more than 150 charges).
 
Back
Top