Soul Spy?

Kia Soul EV Forum

Help Support Kia Soul EV Forum:

This site may earn a commission from merchant affiliate links, including eBay, Amazon, and others.
Status
Not open for further replies.
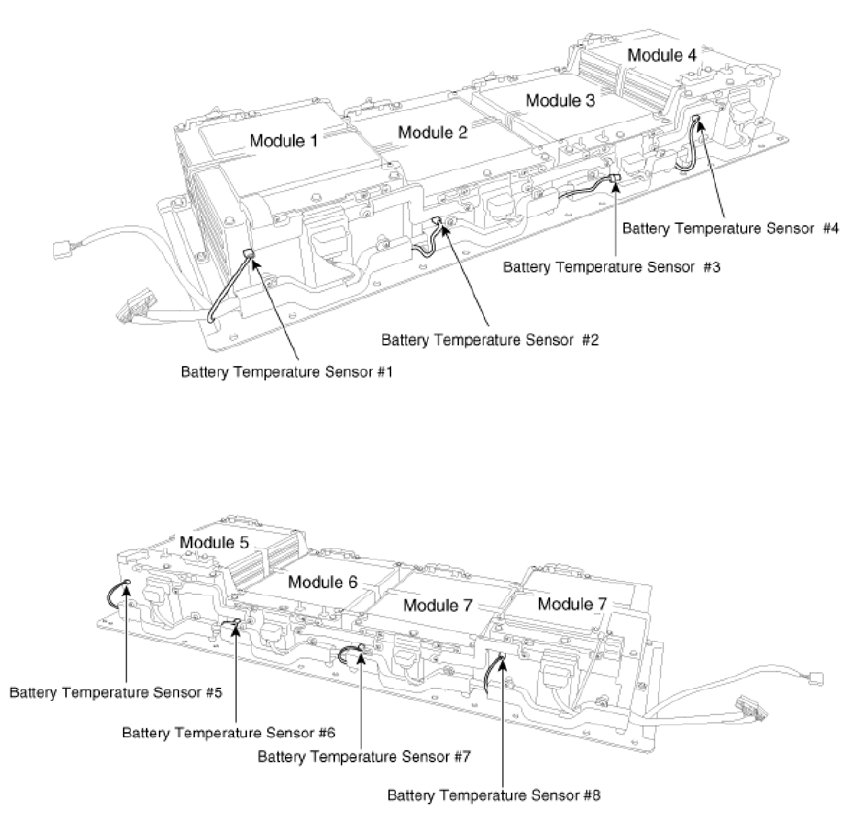
Anyone here who has access to the service manual (I'd love to get the PDF(s) myself!), there's probably a diagram that shows the locations of the temperature sensors. I know the LEAF has such a diagram.
 
SiLiZiUMM said:
On 2105 (7EC) line 23 byte 3 we usually see a 0, I've seen 0x01 during charge (fan status?). I've got a 0x02 there too (on the very last charge). For sure it's a bitfield.

I now think this value is the fan status. From the service manual, the value is an integer from 0-9 (around page 1280). Anyone using a QC in a hotter climate than Canada right now would probably get a higher value than 2!
 
Here's the graphic from that page showing the temperature sensor locations.

FokLfHJ.png


I don't see any great reasons for #8 being lower EXCEPT that it MIGHT be the one that's closest to the air intake -- the module does say that the inlet air temperature sensor is located on Module #8. However I think air also comes in over Module #1, so we would expect it to be similarly cooled... except that the sensors on #1 and #8 are at different relative locations on the modules, which might mean that the intake air isn't hitting Sensor #1 but it is hitting Sensor #8.
 
By the way, this diagram shows how the battery cooling system works. The fan is in the rear of the car, in the bottom of the trunk (lift up the foam divider thing and you can see it there). It presumably vents air to the outside under the trunk.

amusAXq.png
 
This has been mentioned before but I wanted to mentioned it again because these incorrect labels are being carried across into our software.
There is a translation error in the English version of the Battery Management System Data. This error is not in the German version.
The terms Accumulative Charge Power and Accumulative Discharge Power are used in the English version of the Kia Diagnostic System Software.
We have copied these terms from the 'official' source. But both of these values represent energy not power.
The names should be Cumulative Charge and Cumulative Discharge.
The word Cumulative is better here than Accumulative. So we should also change
Accumulative Operating Time to Cumulative Operating Time
Accumulative Charge Current to Cumulative Charge Current
Accumulative Discharge Current to Cumulative Discharge Current
 
JejuSoul said:
This has been mentioned before but I wanted to mentioned it again because these incorrect labels are being carried across into our software.
There is a translation error in the English version of the Battery Management System Data. This error is not in the German version.
The terms Accumulative Charge Power and Accumulative Discharge Power are used in the English version of the Kia Diagnostic System Software.
We have copied these terms from the 'official' source. But both of these values represent energy not power.
The names should be Cumulative Charge and Cumulative Discharge.
The word Cumulative is better here than Accumulative. So we should also change
Accumulative Operating Time to Cumulative Operating Time
Accumulative Charge Current to Cumulative Charge Current
Accumulative Discharge Current to Cumulative Discharge Current

Yes, it would also be correct to say Cumulative Charge/Discharge Energy for the ones that currently say "Accumulative Charge/Discharge Power".

By the way, looking through the service manual, there are a LOT of editors. Clearly they don't spent a lot of time in editing and localization.
 
I opened a new thread to discuss a Battery Ageing Model http://www.mykiasoulev.com/forum/viewtopic.php?p=2565
SiLiZiUMM: I would be interested to see more data from your recent journey.
for example - did you monitor battery data in real-time throughout the journey?
did you notice any difference in cell balancing between the L3 and L1 chargers?
is deterioration more likely during driving or charging? L3 or L1?
can you post the deterioration data before and after this trip,
to answer the question does 1000km in three days cause more deterioration than 1000km in three weeks.

I don't think we are ever going to have a substantial number of cars providing data given how few Soul Evs exist compared to the number of Nissan 1eafs, so I hope we can create a model using more detailed data from a smaller set of cars.
 
TyrelHaveman said:
By the way, looking through the service manual, there are a LOT of editors. Clearly they don't spent a lot of time in editing and localization.
My favourite error is the line warning mechanics not to touch the exhaust because it may be hot.
 
JejuSoul said:
TyrelHaveman said:
By the way, looking through the service manual, there are a LOT of editors. Clearly they don't spent a lot of time in editing and localization.
My favourite error is the line warning mechanics not to touch the exhaust because it may be hot.

My favorite currently is that I said "editors" when I meant to say "errors". How ironic!
 
JejuSoul said:
I opened a new thread to discuss a Battery Ageing Model http://www.mykiasoulev.com/forum/viewtopic.php?p=2565
SiLiZiUMM: I would be interested to see more data from your recent journey.
for example - did you monitor battery data in real-time throughout the journey?
did you notice any difference in cell balancing between the L3 and L1 chargers?
is deterioration more likely during driving or charging? L3 or L1?
can you post the deterioration data before and after this trip,
to answer the question does 1000km in three days cause more deterioration than 1000km in three weeks.

I don't think we are ever going to have a substantial number of cars providing data given how few Soul Evs exist compared to the number of Nissan 1eafs, so I hope we can create a model using more detailed data from a smaller set of cars.

I did not monitor the data in real time, I just plugged the ELM327 while charging on L3.

Here's the data (the interesting part of it, 2105 messages):

BEFORE (a few weeks ago):
7EC 21 00 00 00 00 00 07 07
7EC 22 08 00 00 00 00 23 28
7EC 24 00 2D 07 00 15 0B 82

inlet temp 07 = 7C
min temp 07 = 7C
max temp 08 = 8C
max deterioration 002D = 4.5%
min deterioration 0015 = 2.1%
SOC 82 = 65%

Deschambault arrival:
7EC 21 00 00 00 00 00 12 12
7EC 22 13 00 00 00 00 23 28
7EC 24 00 32 2B 00 06 0D 3B

inlet temp 12 = 18C
min temp 12 = 18C
max temp 13 = 19C
max deterioration 0032 = 5%
min deterioration 0006 = 0.6%
SOC 3B = 29.5%

Deschambault intermediate reading:
7EC 21 00 00 00 00 00 12 12
7EC 22 13 00 00 00 00 23 28
7EC 24 00 32 2B 00 06 0D 3C

inlet temp 12 = 18C
min temp 12 = 18C
max temp 13 = 19C
max deterioration 0032 = 5%
min deterioration 0006 = 0.6%
SOC 3C = 30%

Louiseville:
7EC 21 00 00 00 00 00 1E 20
7EC 22 21 00 00 00 00 23 28
7EC 24 00 32 2B 00 06 0D 23

inlet temp 1E = 30C
min temp 20 = 32C
max temp 21 = 33C
max deterioration 0032 = 5%
min deterioration 0006 = 0.6%
SOC 23 = 17.5%

St-Jerome:
7EC 21 00 00 00 00 00 23 26
7EC 22 28 00 00 00 00 23 28
7EC 24 00 32 2B 00 06 0D 68

inlet temp 23 = 35C
min temp 26 = 38C
max temp 28 = 40C
max deterioration 0032 = 5%
min deterioration 0006 = 0.6%
SOC 68 = 52%


Montebello:
7EC 21 00 00 00 00 00 21 25
7EC 22 27 00 00 00 00 23 28
7EC 24 00 32 2B 00 06 0D 2C

inlet temp 21 = 33C
min temp 25 = 37C
max temp 27 = 39C
max deterioration 0032 = 5%
min deterioration 0006 = 0.6%
SOC 2C = 22%


Montebello leaving:
7EC 21 00 00 00 00 00 27 2B
7EC 22 2D 00 00 00 00 23 28
7EC 24 00 32 2B 00 06 0D A3

inlet temp 27 = 39C
min temp 2b = 43C
max temp 2D = 45C
max deterioration 0032 = 5%
min deterioration 0006 = 0.6%
SOC A3 = 81.5

Level 1:
7EC 21 00 00 00 00 00 0E 0F
7EC 22 10 00 00 00 00 17 A8
7EC 24 00 32 2B 00 06 0D BA

inlet temp 0E = 14C
min temp 0F = 15C
max temp 10 = 16C
max deterioration 0032 = 5%
min deterioration 0006 = 0.6%
SOC BA = 93%


This morning (2015-11-10):
7EC 21 00 00 00 00 00 09 09
7EC 22 09 00 00 00 00 12 AB
7EC 24 00 32 2B 00 06 0D BD

inlet temp 09 = 9C
min temp 09 = 9C
max temp 09 = 9C
max deterioration 0032 = 5%
min deterioration 0006 = 0.6%
SOC BD = 94.5%


According to those numbers, and if we are looking at the right deterioration values, it was pretty stable during the trip, even I have the same value this morning. However, what I don't understand is why I did have a higher min deterioration value weeks before this trip (2.1%) and now the value ix 0.6%.
 
Raw data is here : https://docs.google.com/spreadsheets/d/1d5ul9455lh_F-uYF2divHq69gy_XJdW8BaE2Iq2K6-A/edit?usp=sharing

I'll add notes later!
 
Interesting data.
What surprises me most is how high the average battery temperature gets driving and L3 charging.
Presumably the outside temp is cool, and you already said the fans were on.
This is comparable to the Phoenix Arizona L3 test data for the Nissan 1eaf here - http://avt.inl.gov/pdf/energystorage/DCFC_Study_FactSheet_EOT.pdf
Am not surprised to see that the L1 charging temp is low.

The minimum deterioration is not only less than two weeks ago (2.1), it is less than a month ago (0.8). Yours is the first car to show such improvement. Did you L1 charge to 100% just before the journey. There was a recent article on insideevs.com about a Tesla owner who did this and reduced the deterioration of his battery.

I looked at your data for the cell voltages. It does seem that L1 charging balances the cells best but the difference is marginal.
 
JejuSoul said:
Interesting data.
What surprises me most is how high the average battery temperature gets driving and L3 charging.
Presumably the outside temp is cool, and you already said the fans were on.
This is comparable to the Phoenix Arizona L3 test data for the Nissan 1eaf here - http://avt.inl.gov/pdf/energystorage/DCFC_Study_FactSheet_EOT.pdf
Am not surprised to see that the L1 charging temp is low.

The minimum deterioration is not only less than two weeks ago (2.1), it is less than a month ago (0.8). Yours is the first car to show such improvement. Did you L1 charge to 100% just before the journey. There was a recent article on insideevs.com about a Tesla owner who did this and reduced the deterioration of his battery.

I looked at your data for the cell voltages. It does seem that L1 charging balances the cells best but the difference is marginal.

We did charge on L2 the night before, as usual.

The outside temp was around 15C at Deschambault-Grondines, and probably around 5-10C at Gatineau. The fan were on while charging, if you look on page 18 you can see the fan speeds in the messages (it's the first byte, average between speed 4 and 6).
 
On my LEAFs, going on a long trip ALWAYS improves the reported battery SOH and "Hx" measurements. We don't know whether it ACTUALLY increases the health of the battery or if it just gives the BMS a better idea of what the health actually is. So I'm not surprised at all to see that the min deterioration reading got better.

By the way, in the LEAFs, I've logged data every 15 seconds on very long trips (2400 km) and the SOH and Hx generally increase while driving, and decrease while charging or parked.
 
Yes, interesting. I have now for a couple of days recorded all actions, including slow charging, QC and the trips to work. I think the sample time is about 5 seconds, so coverage is pretty good. I drive 100km every workday (at least), just let me know if there is anything of particular interest I should look at.
 
Bad news on the TPMS. I only got to spend a few minutes with the car parked but I can confirm that those 0x37's in the sheet are not pressures. I have the same 0x37's and my TPMS sensors are showing slightly different pressures and temperatures and none of them are anywhere near 37psi, mine were 34.0-34.5psi or 231-234kPa and 9-11C yet all mine were byte for byte identical apart from the sensor ids.

They are definitely 4 sets of values with the TPMS sensor IDs being the first 4 bytes of those 4 sets of values and they are in the order Front Left, Front Right, Rear Left, Rear Right.

I suspect the pressures and temperatures must be somewhere else. I was wondering if they only read dynamically and as I hadn't driven the car for a couple of hours the sensors were not being read by the car, but that makes no sense for the diagnostic program. My VT30 was reading them fine so they had to be switched on.

I suspect the 0x37's are either a status flag field or just a delimiter.
 
notfred said:
Bad news on the TPMS.

I suspect the 0x37's are either a status flag field or just a delimiter.

Thanks. I'll update the spreadsheet.

In the case of the LEAF, the car only reports tire pressures while driving (specifically, in CAR_CAN message 385), so I wonder if this is a similar case, and will show up in one of the C_CAN messages? We'd be looking for four similar values, probably right next to each other in the same message.
 
I tried to read the TMPS-ECU yesterday and I didn't discover anything useful, but the last byte have changed since last time I checked.

​This were the result from 2106 some days ago:
00 25 A7 CB 00 37 00 00
00 25 3E 93 00 37 00 00
00 25 9D F5 00 37 00 00
00 25 3F 65 00 37 00 00

This is the result from 2106 yesterday:
00 25 A7 CB 00 37 00 02
00 25 3E 93 00 37 00 02
00 25 9D F5 00 37 00 02
00 25 3F 65 00 37 00 02

The last values are now 0x02.

Btw. what kind of OBD-readers are you guys using? I tried to log every single frame on the can-bus, but my two ELM-clones give up after 20 frames or so because the serial buffer got full. Any tips to a really good OBD-reader?
 
Status
Not open for further replies.
Back
Top